Finally back again from an amazing holiday in Australia...Stocks made a nice move up.
What happened?
Despite a downgrade of several European coutries investors seem to find their way back to stocks again. There are several reasons: America's industry, still the leading benchmark for stocks, delivers promising data, companies provide good quarterly reports and good alternative investments to stocks are missing. On the other side there is still the European debt crisis. However, investors either start to believe in the reforms or they don't care about this issue that much any more. North European indizes and Germany belong to the top performers in 2012 so far. This however, also fundamentally makes sense. German blue chips make almost 50% of their business outside the EU and about 25% within Germany.
What to expect now in the near future?
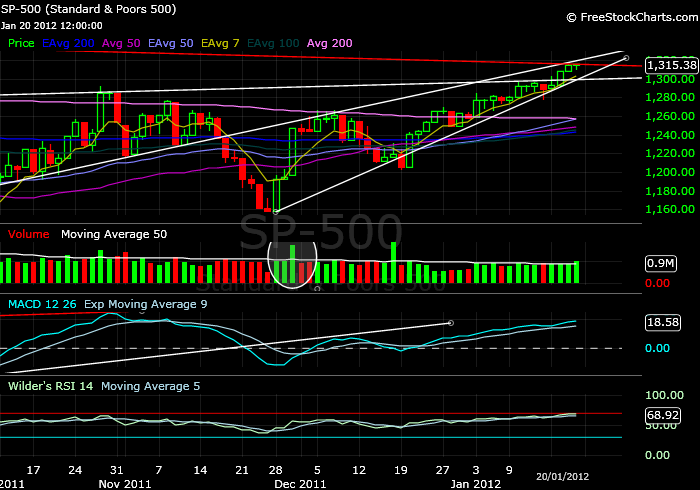
S&P: The sound short term uptrend is facing now the mid term downtrend resistance line. All investors are aware of this line and most of them probably expect the S&P to bounce to the downside from there. Additionally many indicators show an overbought market. I expect a small bounce to the downside. But I'm sure this line will fall soon. Many investors are already short in expectation of a falling market. As soon as this line falls the market will jump up since all these shorts have to be covered.
Bonds: TLT is still in kind of neutral area. However, TLT failed several times to make a new high resulting in lower highs. A first reliable indication that the uptrend in broken would be a break of the red line on which TLT is sitting right now. I expect it to fall soon.
Gold: Gold is running into a huge falling wedge which started in Sep 2011. In the short run we see a properly developed rising wedge which is about to break soon. I expect a break of the rising wedge resulting in a minor drop of about 5% (probably together with stocks) to the red line from where the price will bounce up and breach the falling wedge resulting in rising prices (together with stocks).
Strategy for this week:
stocks: In expectation of a consolidation i will set tight stops to my long positions. Additionally i might look for a few stocks to short.
Bonds: In case TLT will move below the red line i consider to increase my position in TBT.
Gold: I probably won't trade the bounce to the downside. I wait for a good opportunity to go long again.
Good luck!